How to Track Data Centers in Your Backyard
Discover how to find power-hungry data centers near you using a new interactive map and understand the impact on your local community.
Have you ever wondered what that massive, windowless warehouse down the road does? It might not be a storage facility or a shipping hub. It could be an AI data center, silently humming while it eats up massive amounts of local power and water. Most of us walk past these grey monoliths every day without a second thought.
But these buildings are becoming the backbone of our digital world. They power the apps you use, the sites you visit, and the AI models that seem to be everywhere lately. They are quiet, but they are also hungry. They need electricity and water in quantities that would shock the average neighbor.
If you feel like you are being kept in the dark, you are not alone. A new tool is finally pulling back the curtain on these facilities. It gives you a clear view of where they are and what they are doing. Let's look at how you can see what is happening in your own backyard.
The hidden cost of our digital lives
Most people do not realize that every digital click has a physical footprint. We assume our data lives in a fluffy cloud. It does not. It lives in concrete boxes filled with servers that need constant cooling and power.
In places like The Dalles, Oregon, this reality hit home hard. A major tech giant built a campus there that uses a huge chunk of the town's water. Residents watched as their resources were diverted to keep servers from overheating. It made people ask hard questions about who really benefits from these deals.
The issue isn't just about water. It's about power grids. These centers suck up so much electricity that they can drive up utility bills for everyone else in the area. When the demand goes up, the price you pay goes up too. It's a simple rule of supply and demand that often gets buried in legal jargon.
This is why local pushback is growing. People are tired of being treated like bystanders in their own towns. They want to know why a facility was approved, who signed off on the water rights, and what the community gets in return. The era of the silent neighbor is coming to an end.
Mapping the digital footprint
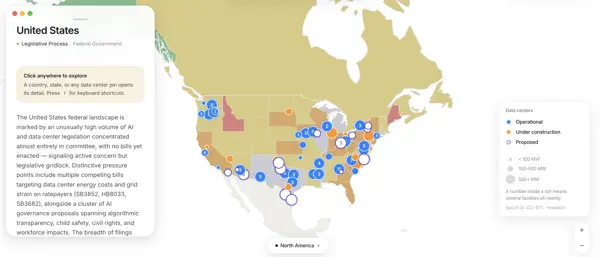
Isabelle Reksopuro decided to do something about the lack of information. As a student, she saw how hard it was to find clear answers. She wanted a way to show her family and her community exactly what was being built nearby. So, she built an interactive map.
The map tracks both data center construction and local policy changes. It pulls information from various sources to show you what is happening in your state. She designed it to be simple. You don't need to be a tech expert to understand what is going on.
She uses Claude to keep the map updated. It scans for new news and data four times every day. When it finds something, it summarizes the info and puts it right on the map. This means you aren't looking at old, stale data. You are looking at the current state of play.
The goal is to provide leverage. If you know a project is coming, you can talk to your local leaders before the cement is poured. You can ask for better tax deals or demand that the company invests in local jobs. Knowledge gives you the power to negotiate.
It's not about being anti-tech. Most people just want a seat at the table. They want to know that their community isn't being used as a cheap resource for a company that doesn't care about the local impact. Transparency is the first step toward a fair deal.
The map shows that every state handles this differently. Some, like Texas, offer massive tax breaks to attract these facilities. Others are starting to push back with moratoriums. It is a messy, complicated patchwork, but the map makes it easy to spot the trends.
How the system works
Data centers are basically giant, high-performance computers stacked in rows. They generate massive heat while they process your requests. To keep them running, they need massive cooling systems. This is why they often sit near large water sources or power plants.
When you use an AI tool, you are sending a request to one of these boxes. The hardware inside works for a fraction of a second to give you an answer. Multiply that by millions of users, and you can see why they need so much energy. They never sleep.
The power grid is often the biggest bottleneck. These centers require so much juice that they sometimes need their own dedicated substations. This can strain the local grid and create problems for homes and small businesses. It is a massive engineering challenge that often goes ignored until a blackout happens.
Policy-wise, these companies often use legal loopholes to hide their impact. They might sign private deals with cities that keep the public out of the loop. The lack of standardized rules means companies can shop around for the easiest path. This is exactly what the map helps to expose.
Looking toward a more open future
We are going to see more of these facilities in the future. The demand for AI isn't going to drop. If anything, it will grow. This means the pressure on local resources will only get stronger as the years go by.
The fight for transparency is just beginning. Tools like this map are vital for keeping the public informed. When people have the facts, they can push for better policies. We need to hold these tech giants accountable for the space they occupy.
Expect to see more debates about energy usage and water rights. These aren't just technical issues anymore. They are political issues. They affect how our towns grow and how our resources are managed. You should stay informed.
Quick questions answered
- Are all data centers the same? No, they vary by size and purpose. Some are small edge nodes, while others are massive hyperscale campuses.
- Why do they need so much water? They use water for evaporative cooling to stop the servers from overheating. It is cheaper than using air conditioning.
- Can I stop a data center from being built? It is difficult, but not impossible. Local zoning boards often hold public hearings where you can voice your concerns.
- Does the map cover the whole world? It focuses on areas where data is available and legislation is active, but it is growing as more data is added.
- What is a hyperscale data center? It is a massive facility designed to support high-density workloads, usually owned by companies like Google, Amazon, or Microsoft.
My honest take on this
I think the secrecy surrounding these buildings is a huge problem. It's not just bad for the neighbors; it's bad for the industry. If these companies were more open, they might avoid the massive backlash they are currently facing. Being a "good neighbor" shouldn't be a radical idea.
The thing that gets me is how we just accepted this. We treat these giant boxes like they are invisible. We need to stop looking at tech as some magical, weightless force. It has mass, it has a cost, and it has a location. We should treat it like any other major infrastructure project.
I really like the idea of using tools to map this out. It turns a vague, scary concept into something concrete. If you can see the data center on a map, you can ask your city council why they approved it. You can track the tax breaks. You can ask for better outcomes.
Honestly, my take is that we need more of this. We need to track the power, the water, and the money. If we don't, we are just letting these companies run the show without any oversight. It's time to start paying attention to what's happening in our own backyards before it's too late.